
Wednesday, 15 November 2017

Wednesday, November 15
Phonics
Today, students explored the sound/letter and song for the letter Bb.
Students watched bounce patrol
After, students brainstormed words that have the b sound..

After, students created the letter b using playdough


Journal
Students worked in their journals and wrote a list of words that start with f and b.


Math: Data Management
Students continued learning about graphs. Students know that graphs give us information. As a class, we came up a vote to see what is the most popular movie.
The options were: frozen, ninja turtles, frosty the snowman, descendants 2, and minions.
Students voted for their favorite movie.

Students used the graph to determine which movie was the most popular.
Frosty the snowman was the most favorite movie and descendants and minion were the least favorite movie.
After, students worked in their workbook and filled in a graph with 3 different colored cubes. Students went around the room and asked their peers what their favorite color is.
Students had so much fun collecting data!
After, we came back to the carpet and students shared their findings with the class.


Gym with Mrs. Jans
Unit of Inquiry: Sensational Senses
We continued exploring the sense of hearing. We played a guessing game where students had to shake 5 different eggs which contained different objects inside: kernels, tissue paper, rocks, links and seeds.
Students shook the eggs and guessed which item they thought was inside.
We created a graph to record the answers. After, we opened the eggs to see what was actually inside.


The students were so excited to find out what was actually inside the eggs
French with Mlle. Jessica
Thank you,
Ms. Ayoub
Tuesday, 14 November 2017
Phonics
We started the day by reviewing the letter/sound Ff.
Students worked on a letter Ff worksheet.


Music with Ms. Hayward
Math
Unit: Data Management
Today students explored graphs. First, students were asked to look at a picture graph and describe what they know.

Some students said that this graph shows us that people like Pizza.
I explained to students that this is a picture graph and that graphs help tell us information about something. Students then guessed that this graph is telling us what people like to eat.
Students knew that the most popular food was Pizza because it had the most votes, Pita was the second most favorite and hot dog was the least.
We created a KWL chart together.

After, I gathered a bunch of different items from the classroom and told students that I need to sort out my objects, what should I do first?

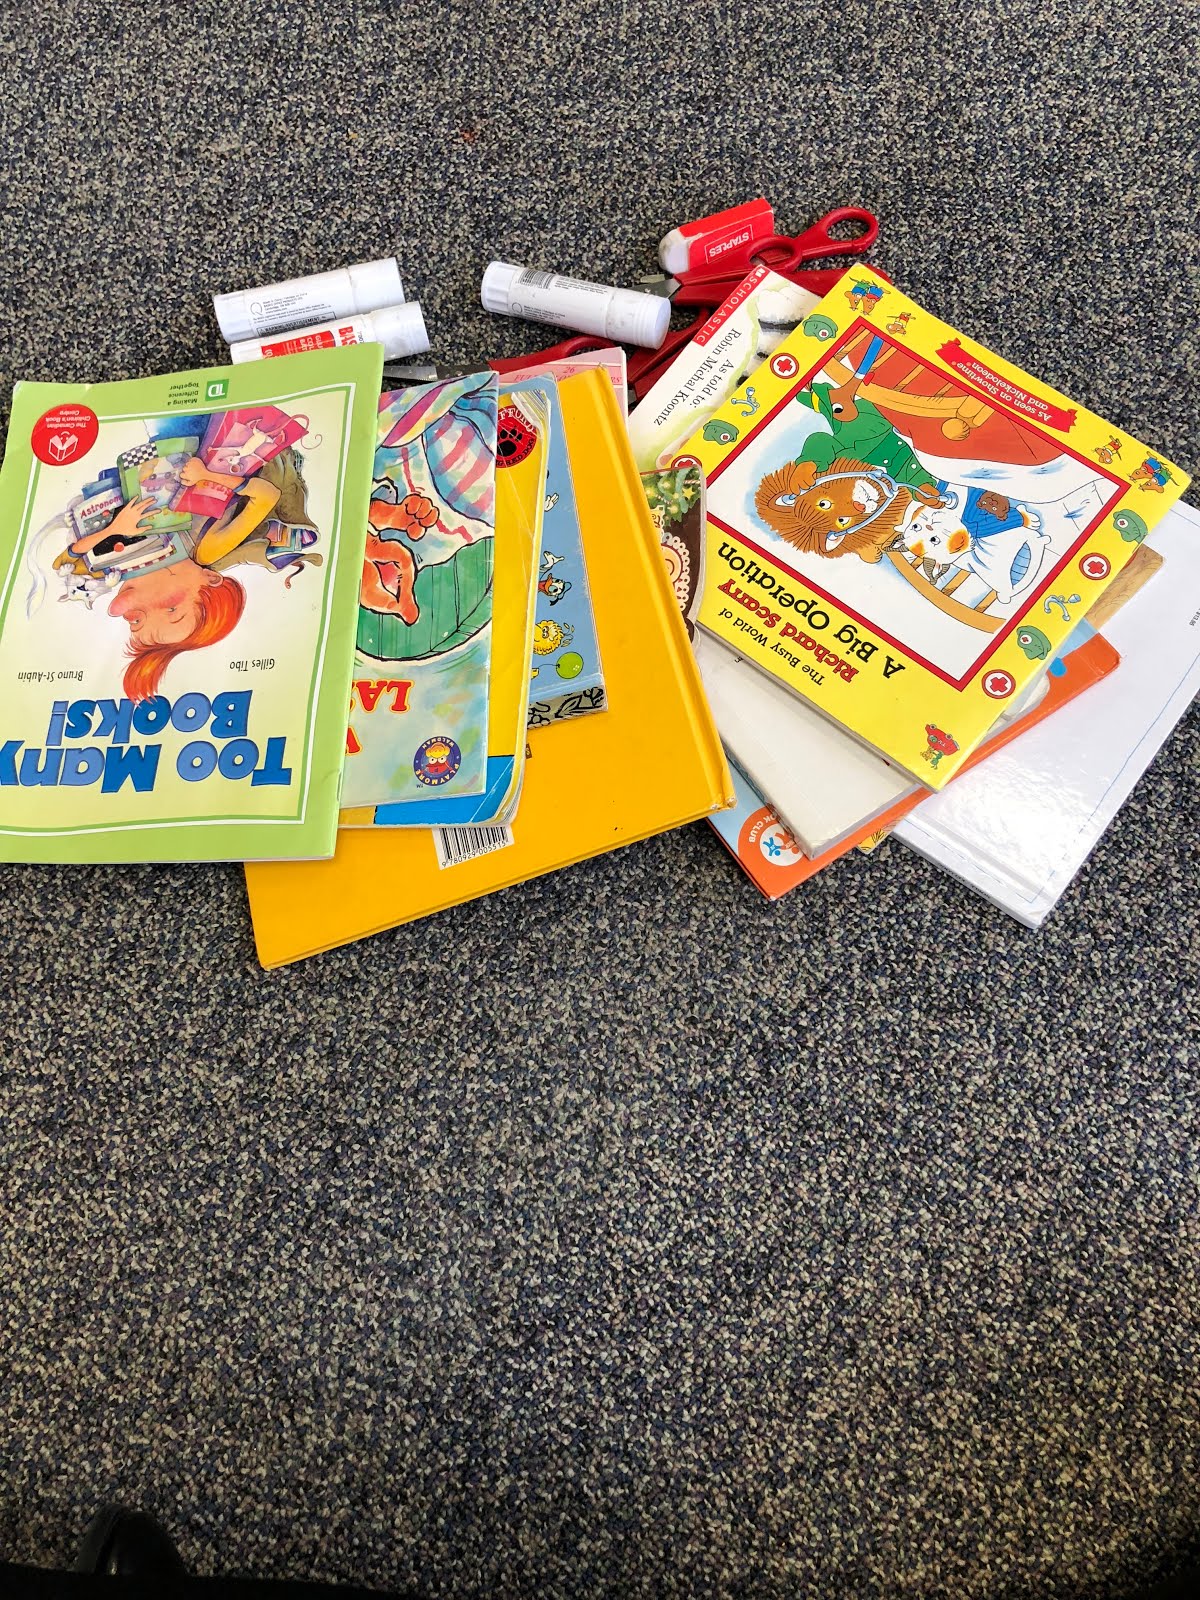
Students suggested that I organize the objects and put them in groups. So we put the books together, the scissors together, the glue together and the eraser together. Then, we counted the items and placed them in a graph. Students were able to identify which item I had the most of.
After, I told students that I wanted to know what their favorite food is.
I came up with 4 different types of food and students voted their favorite food.

Students were asked to describe the graph and what it is trying to tell us.
Students know that Pasta was the most favorite food in S.K

After, students worked in their math work book and colored in a graph to see what color bean is the most popular. Students asked their friends at their table.
First, we did one together as a class.
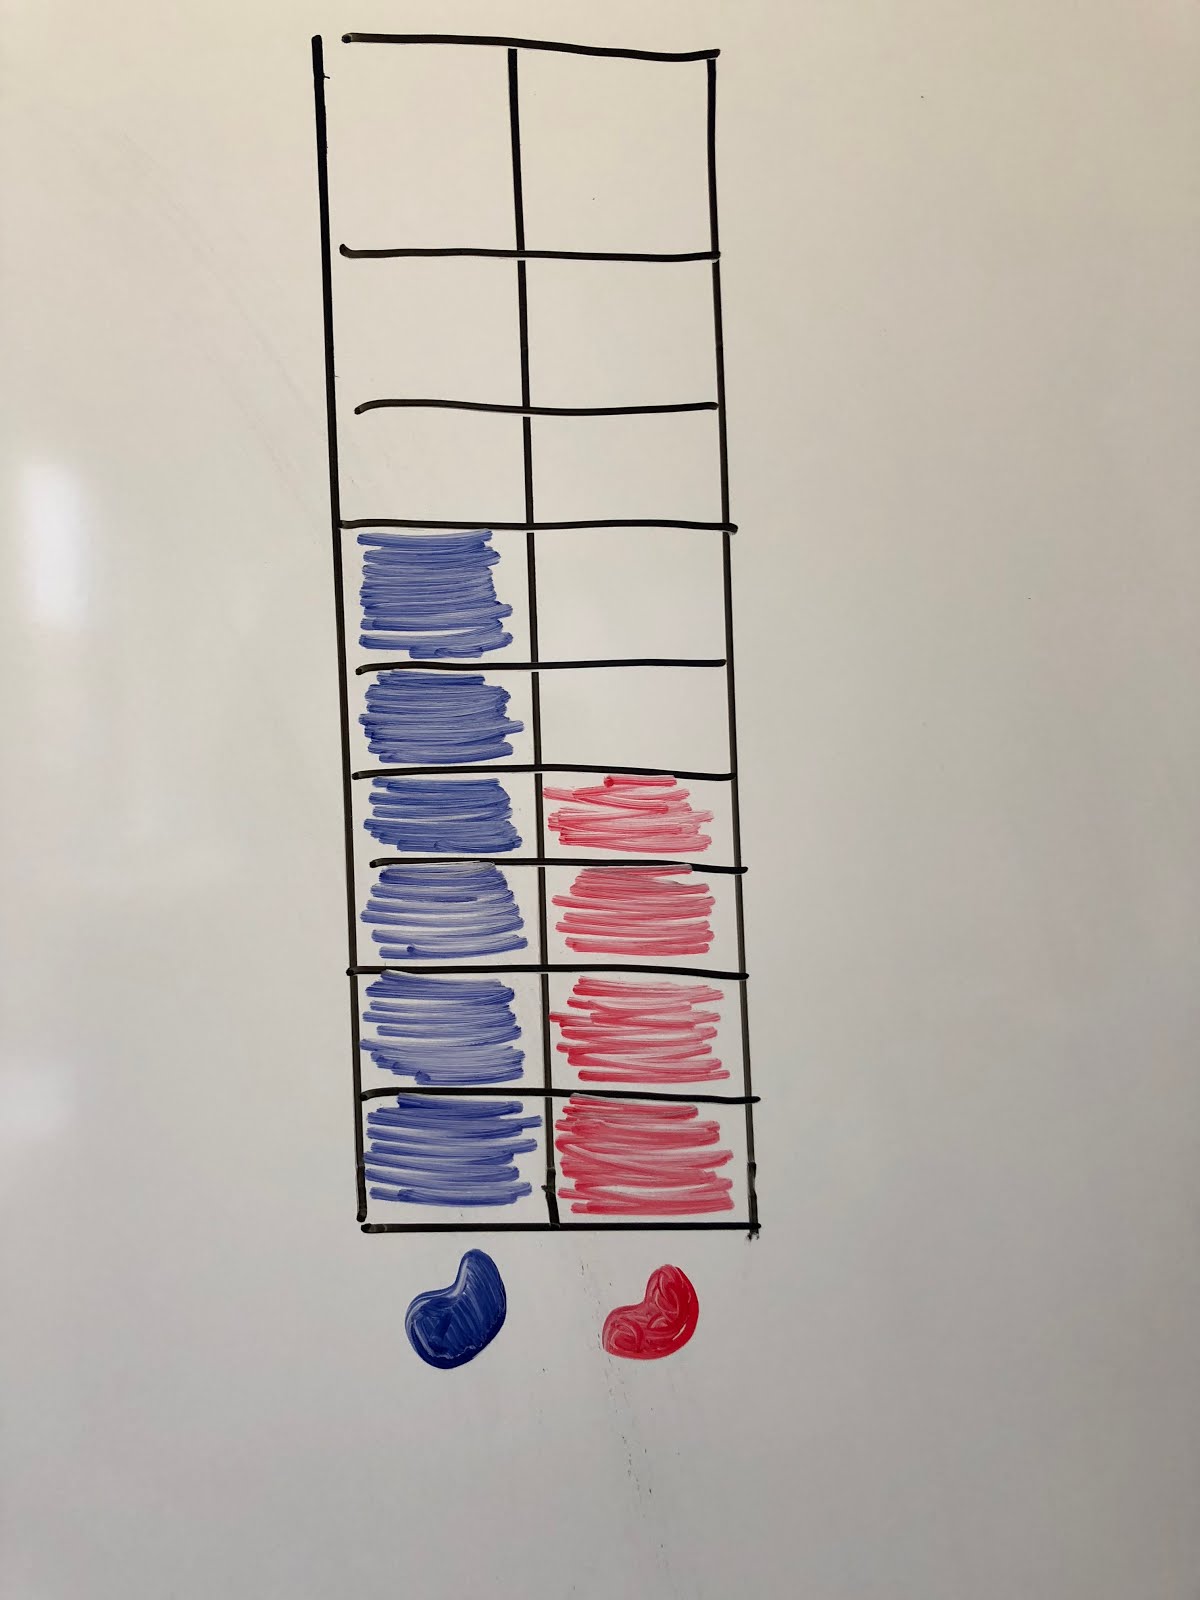
The most popular bean was the blue bean!


Students had so much fun collecting data!
We took up their findings as a class after.
Gym with Mrs. Jans
Kindness tree
Students took their kindness message and we stuck it on the tree in the auditorium


Silent Reading
Students looked through books and read some familiar words and recognized letters and sounds.


French with Mlle. Jessica
Thank you,
Ms. Ayoub
Subscribe to:
Posts (Atom)